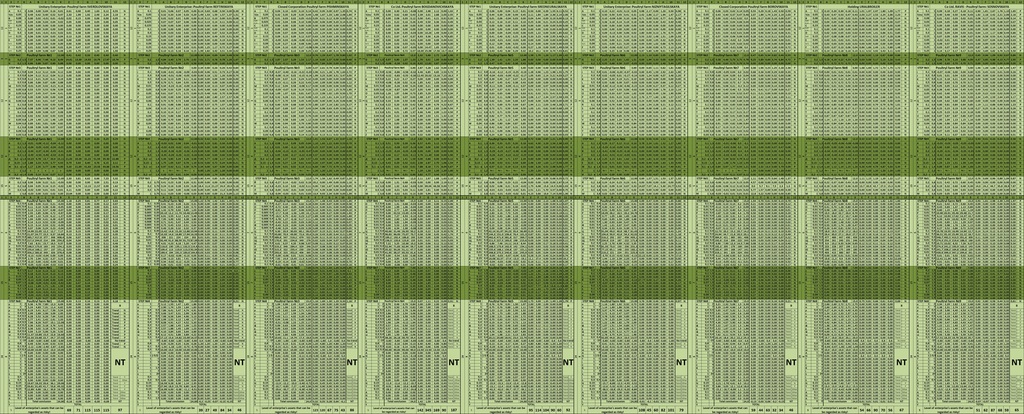
The A-MATRIX Alexander Shemetev
amatrix.jpg:7069x2860, 256k
|
|
|
|
The A-MATRIX Alexander Shemetev amatrix.jpg:7069x2860, 256k |
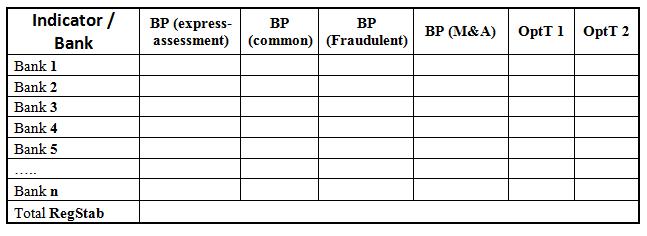 Table F – Short variant A-matrix of regional segmentation of the banking sector Alexander Shemetev betterbank.jpg:647x236, 29k |
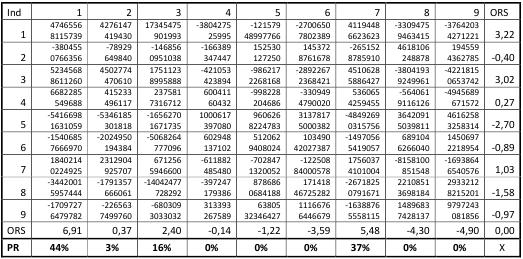 The ORS matrix for the Urals Federal District Alexander Shemetev betterors2.jpg:523x259, 51k |
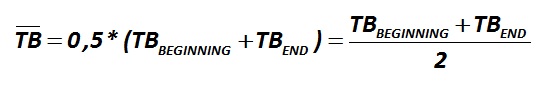 It should be considered the result of a balance in an average during a year Alexander Shemetev f1.jpg:555x87, 18k |
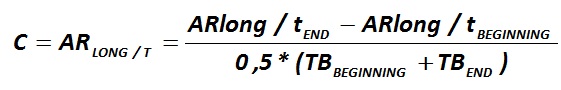 The indicator C is calculated by the formula Alexander Shemetev f10.jpg:561x90, 24k |
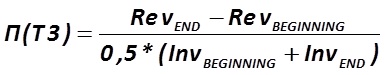 The indicator П (Т3) is calculated by the formula Alexander Shemetev f100.jpg:388x75, 18k |
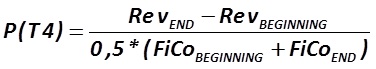 The indicator Р (Т4) is calculated by the formula Alexander Shemetev f102.jpg:376x69, 17k |
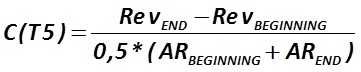 The indicator С (Т5) is calculated by the formula Alexander Shemetev f104.jpg:361x72, 18k |
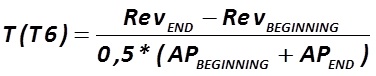 The indicator Т (Т6) is calculated by the formula Alexander Shemetev f106.jpg:376x76, 18k |
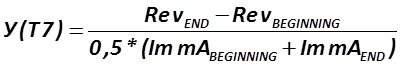 The indicator У (Т7) is calculated by the formula Alexander Shemetev f108.jpg:404x68, 18k |
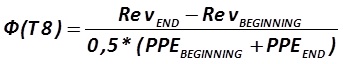 The indicator Ф (Т8) is calculated by the formula Alexander Shemetev f110.jpg:343x64, 17k |
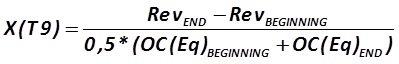 The indicator Х (Т9) is calculated by the formula Alexander Shemetev f112.jpg:399x64, 18k |
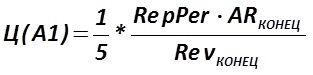 The indicator Ц (А1) is calculated by the formula Alexander Shemetev f114.jpg:313x75, 15k |
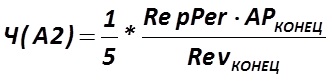 The indicator Ч (А2) is calculated by the formula Alexander Shemetev f116.jpg:332x81, 16k |
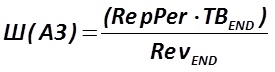 The indicator Ш (А3) is calculated by the formula Alexander Shemetev f118.jpg:275x72, 14k |
 The indicator Ш (А3) is calculated by the formula Alexander Shemetev f119.jpg:325x77, 15k |
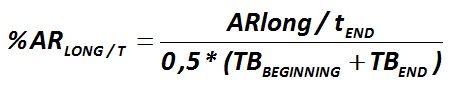 The formula for calculating the share of Account Receivable in long term (%ARlong/t) Alexander Shemetev f12.jpg:455x94, 21k |
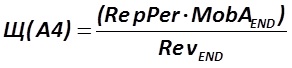 The indicator Щ (А4) is calculated by the formula Alexander Shemetev f120.jpg:292x68, 14k |
 The indicator Щ (А4) is calculated by the formula Alexander Shemetev f121.jpg:325x78, 15k |
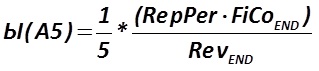 The indicator Ы (А5) is calculated by the formula Alexander Shemetev f122.jpg:319x71, 15k |
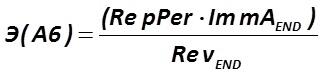 The indicator Э (А6) is calculated by the formula Alexander Shemetev f124.jpg:325x76, 15k |
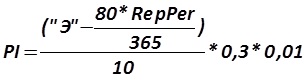 The indicator Э (А6) is calculated by the formula Alexander Shemetev f125.jpg:305x80, 15k |
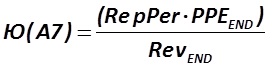 The indicator Ю (А7) is calculated by the formula Alexander Shemetev f126.jpg:272x70, 14k |
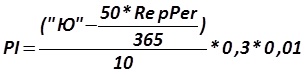 The indicator Ю (А7) is calculated by the formula Alexander Shemetev f127.jpg:305x75, 14k |
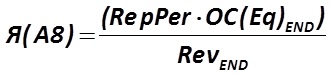 The indicator Я (А8) is calculated by the formula Alexander Shemetev f128.jpg:332x77, 16k |
 The indicator Я (А8) is calculated by the formula Alexander Shemetev f129.jpg:325x77, 14k |
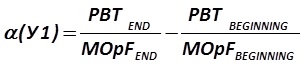 The indicator α (У1) is calculated by the formula Alexander Shemetev f130.jpg:305x66, 15k |
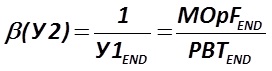 The indicator β (У2) is calculated by the formula Alexander Shemetev f132.jpg:272x71, 14k |
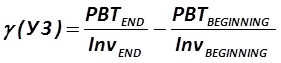 The indicator γ (У3) is calculated by the formula Alexander Shemetev f134.jpg:281x63, 15k |
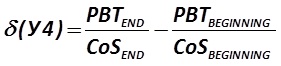 The indicator δ (У4) is calculated by the formula Alexander Shemetev f136.jpg:281x66, 15k |
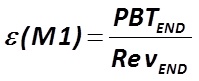 The indicator ε (М1) is calculated by the formula Alexander Shemetev f138.jpg:199x81, 13k |
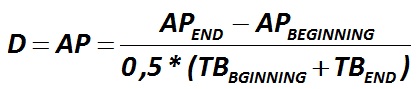 The indicator D is calculated by the formula Alexander Shemetev f14.jpg:420x89, 21k |
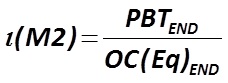 The indicator ζ (М2) is calculated by the formula Alexander Shemetev f140.jpg:228x83, 14k |
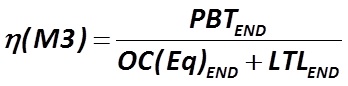 The indicator η (М3) is calculated by the formula Alexander Shemetev f142.jpg:348x86, 16k |
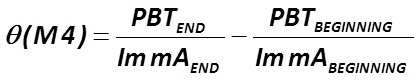 The indicator θ (М4) is calculated by the formula Alexander Shemetev f144.jpg:420x80, 20k |
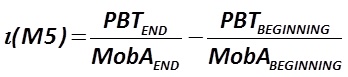 The indicator ι (М5) is calculated by the formula Alexander Shemetev f146.jpg:348x77, 17k |
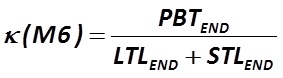 The indicator κ (М6) is calculated by the formula Alexander Shemetev f148.jpg:283x78, 14k |
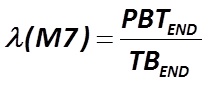 The indicator λ (М7) is calculated by the formula Alexander Shemetev f150.jpg:210x85, 12k |
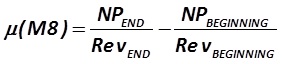 The indicator μ (М8) is calculated by the formula Alexander Shemetev f152.jpg:283x64, 15k |
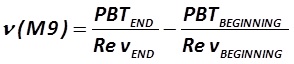 The indicator ν (М9) is calculated by the formula Alexander Shemetev f154.jpg:294x64, 15k |
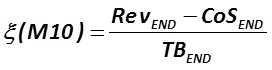 The indicator ξ (М10) is calculated by the formula Alexander Shemetev f156.jpg:272x70, 13k |
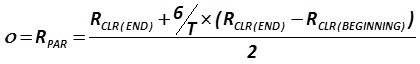 The indicator ο is calculated by the formula Russian legislative approach f158.jpg:420x64, 15k |
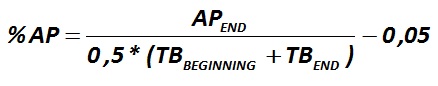 The formula for calculating the share of Account Payable (%AP) Alexander Shemetev f16.jpg:438x86, 18k |
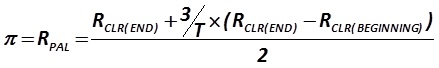 The indicator π is calculated by the formula Russian legislative approach f160.jpg:439x68, 15k |
|
Z-trend estimation Alexander Shemetev f163.jpg:292x42, 12k |
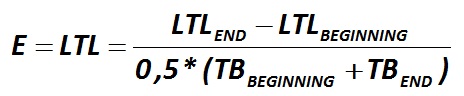 The indicator E is calculated by the formula Alexander Shemetev f18.jpg:464x96, 23k |
 The indicator υ is calculated by the formula John Fulmer f180.jpg:655x60, 27k |
|
The indicator ω is calculated by the formula Edward Altman f187.jpg:550x34, 17k |
 The indicator ό is calculated by the formula Russian legislative approach f191.jpg:427x70, 18k |
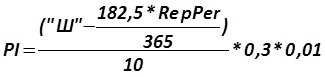
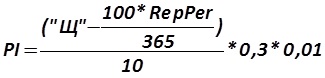
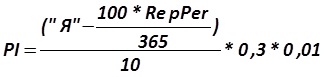
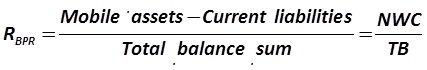
 If the RBPR is above 50%, there is no PI: you should put 0. Otherwise, please, see the interpretation below Alexander Shemetev f192.jpg:413x184, 48k |
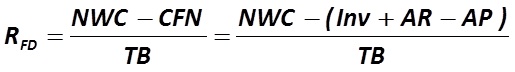 Here is used the ratio of funds deficit that is calculated using the next formula Alexander Shemetev f198.jpg:515x72, 18k |
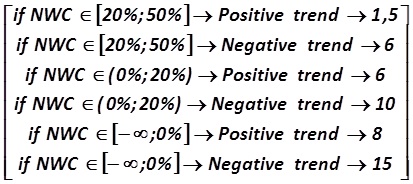
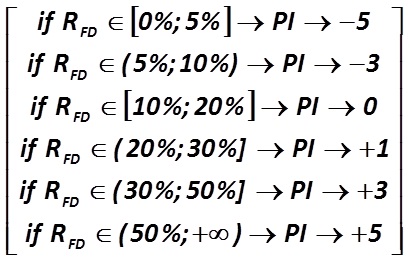 The RFD ratio for this model is to be analyzed by the next algorithm Alexander Shemetev f199.jpg:410x262, 50k |
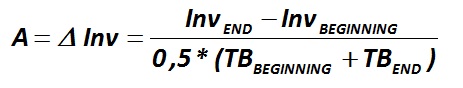 The formula for calculating a growth of Inventories/stocks (Inv) in the model (Indicator A) Alexander Shemetev f2.jpg:463x88, 20k |
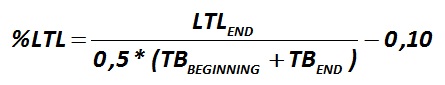 The formula for calculating the share of Long-Term Liabilities (%LTL) Alexander Shemetev f20.jpg:445x85, 18k |
 If amortization is unknown directly - use this formula Alexander Shemetev f201.jpg:397x120, 22k |
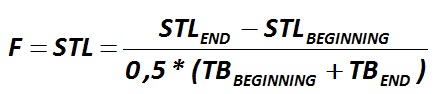 The indicator F is calculated by the formula Alexander Shemetev f21.jpg:436x94, 21k |
 The minimum total value of the Insurance reserve for companies must be equal to Alexander Shemetev f213.jpg:290x104, 17k |
|
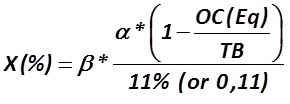
The value of X – is the amount of the insurance reserve company, expressed as a percentage of the net worth. Alexander Shemetev f214.jpg:319x40, 13k |
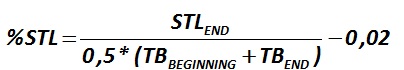 The formula for calculating the share of Short-Term Liabilities (%STL) Alexander Shemetev f23.jpg:404x70, 17k |
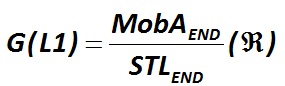 Ratio G (or L1) is calculated by the formula Alexander Shemetev f25.jpg:285x86, 16k |
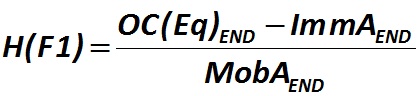 The indicator H (F1) is calculated by the formula Alexander Shemetev f28.jpg:420x96, 22k |
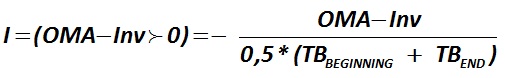 The indicator I (OMA–Inv) is calculated by the formula Alexander Shemetev f30.jpg:505x78, 20k |
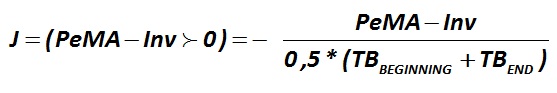 The indicator J is calculated by the formula Alexander Shemetev f32.jpg:557x93, 21k |
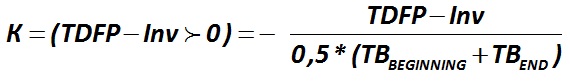 The indicator K is calculated by the formula Alexander Shemetev f34.jpg:570x83, 22k |
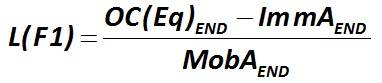 The indicator L (F1) is calculated by the formula Alexander Shemetev f36.jpg:382x83, 19k |
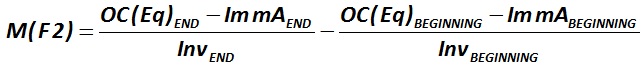 The indicator M (F2) is calculated by the formula Alexander Shemetev f38.jpg:644x68, 25k |
 The formula for calculating the share of Inventories/stocks (Inv): Alexander Shemetev f4.jpg:468x85, 20k |
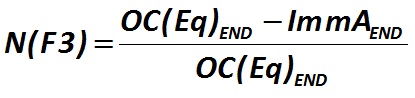 The indicator N (F3) is calculated by the formula Alexander Shemetev f40.jpg:415x98, 21k |
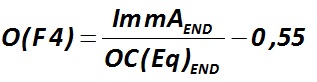 The indicator О (F4) is calculated by the formula Alexander Shemetev f42.jpg:317x82, 17k |
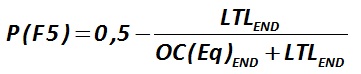 The indicator Р (F5) is calculated by the formula Alexander Shemetev f44.jpg:361x74, 17k |
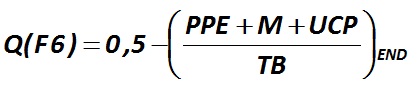 The indicator Q (F6) is calculated by the formula Alexander Shemetev f46.jpg:420x91, 18k |
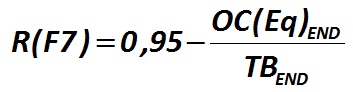 The indicator R (F7) is calculated by the formula Alexander Shemetev f48.jpg:353x92, 18k |
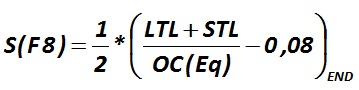 The indicator S (F8) is calculated by the formula Alexander Shemetev f50.jpg:359x90, 18k |
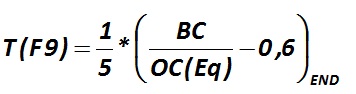 The indicator Т (F9) is calculated by the formula Alexander Shemetev f52.jpg:356x94, 17k |
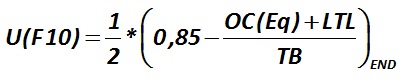 The indicator U (F10) is calculated by the formula Alexander Shemetev f54.jpg:406x84, 18k |
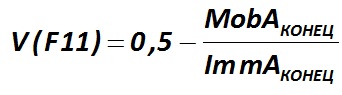 The indicator V (F11) is calculated by the formula Alexander Shemetev f56.jpg:342x95, 18k |
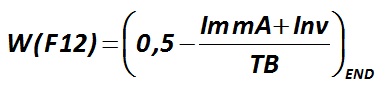 The indicator W (F12) is calculated by the formula Alexander Shemetev f58.jpg:387x93, 18k |
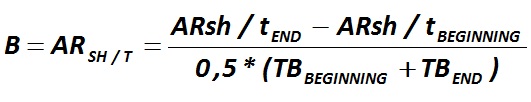 The indicator B is calculated by the formula (2.6): Alexander Shemetev f6.jpg:531x102, 26k |
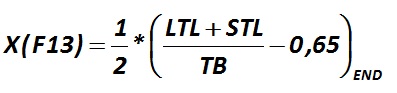 The indicator Х (F13) is calculated by the formula Alexander Shemetev f60.jpg:397x93, 18k |
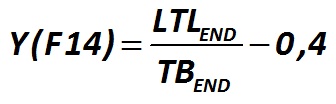 The indicator Y (F14) is calculated by the formula Alexander Shemetev f62.jpg:336x104, 17k |
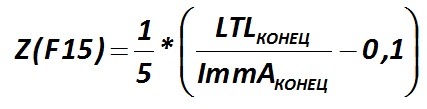 The indicator Z (F15) is calculated by the formula Alexander Shemetev f64.jpg:427x109, 21k |
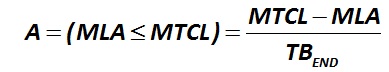 The indicator А (MLA ≤ MTCL) is calculated by the formula Alexander Shemetev f66.jpg:389x72, 15k |
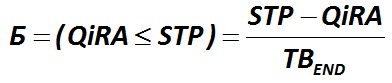 The indicator Б (QiRA ≤ STP) is calculated by the formula Alexander Shemetev f68.jpg:392x83, 18k |
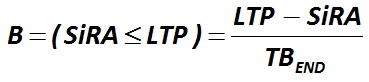 The indicator В (SiRA ≤ LTP) is calculated by the formula Alexander Shemetev f70.jpg:369x82, 17k |
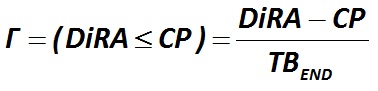 The indicator Г (DiRA ≥ CP) is calculated by the formula Alexander Shemetev f72.jpg:378x91, 17k |
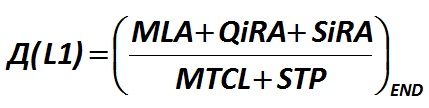 The indicator Д /or G (or L1)/ is calculated by the formula Alexander Shemetev f74.jpg:429x108, 24k |
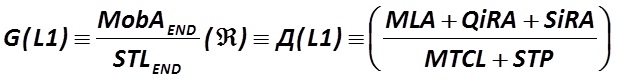 The indicator Д /or G (or L1)/ is calculated by the formula Alexander Shemetev f75.jpg:618x81, 25k |
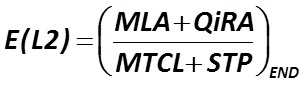 The indicator Е (L2) is calculated by the formula Alexander Shemetev f78.jpg:305x85, 17k |
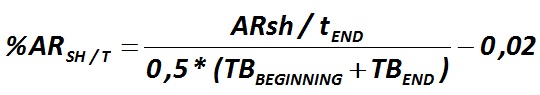 The formula for calculating the share of Account Receivable in short term (%ARsh/t) Alexander Shemetev f8.jpg:540x95, 23k |
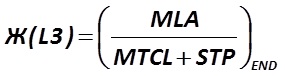 The indicator Ж (L3) is calculated by the formula Alexander Shemetev f81.jpg:285x76, 15k |
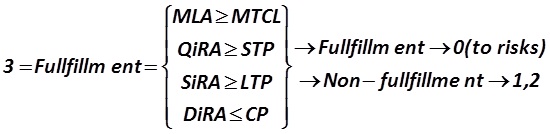 The indicator З – is the L4 inequality system carrying out Alexander Shemetev f84.jpg:550x134, 28k |
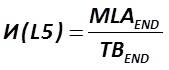 The indicator И is calculated by the formula Alexander Shemetev f85.jpg:169x70, 11k |
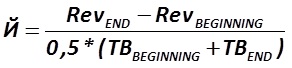 The indicator Й is calculated by the formula Alexander Shemetev f88.jpg:292x68, 16k |
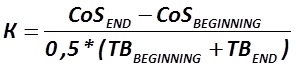 The indicator К is calculated by the formula Alexander Shemetev f90.jpg:297x70, 16k |
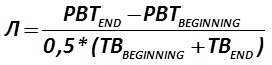 The indicator Л is calculated by the formula Alexander Shemetev f92.jpg:272x65, 16k |
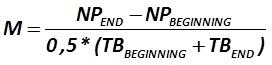 The indicator ћМЋ is calculated by the formula Alexander Shemetev f94.jpg:272x65, 15k |
|
The indicator Н (Т1) is calculated by the formula Alexander Shemetev f96.jpg:689x54, 24k |
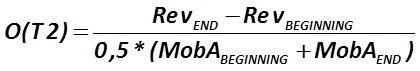 The indicator О (Т2) is calculated by the formula Alexander Shemetev f98.jpg:420x71, 19k |
 Alexander Shemetev's photo Alexander Shemetev myphoto.jpg:153x153, 13k |
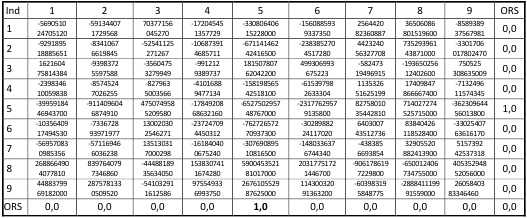
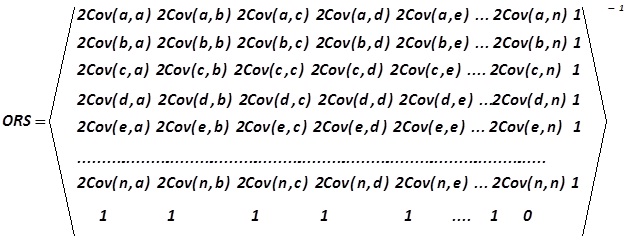 ORS – this is the optimal risky matrix structure of an industry to forecast the risk of its development (the optimal structure will match the lower row of the matrix). Alexander Shemetev ors.jpg:627x240, 60k |
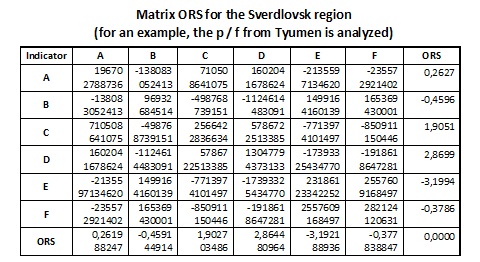 Matrix ORS for the Sverdlovsk region Alexander Shemetev ors1.jpg:480x262, 79k |
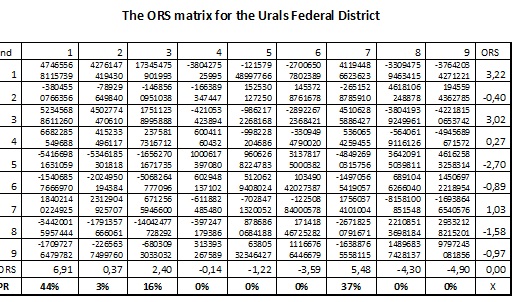 The ORS matrix for the Ural Federal District (UFD) Alexander Shemetev ors2.jpg:520x302, 109k |
 ORS matrix (for cash flow) for the Ural Federal District Alexander Shemetev ors3.jpg:527x218, 72k |
|
R letter (for typographic operations) Alexander Shemetev r.jpg:28x27, 8k |
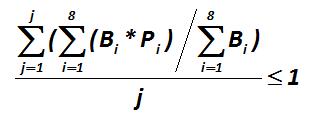 The risk stability of the entire sector in the region is calculated by the formula developed by the author Alexander Shemetev rr1.jpg:313x120, 6k |
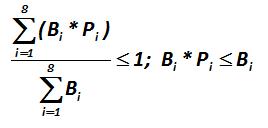 The risk stability of individual companies is calculated by the formula developed by the author Alexander Shemetev rr2.jpg:268x128, 5k |
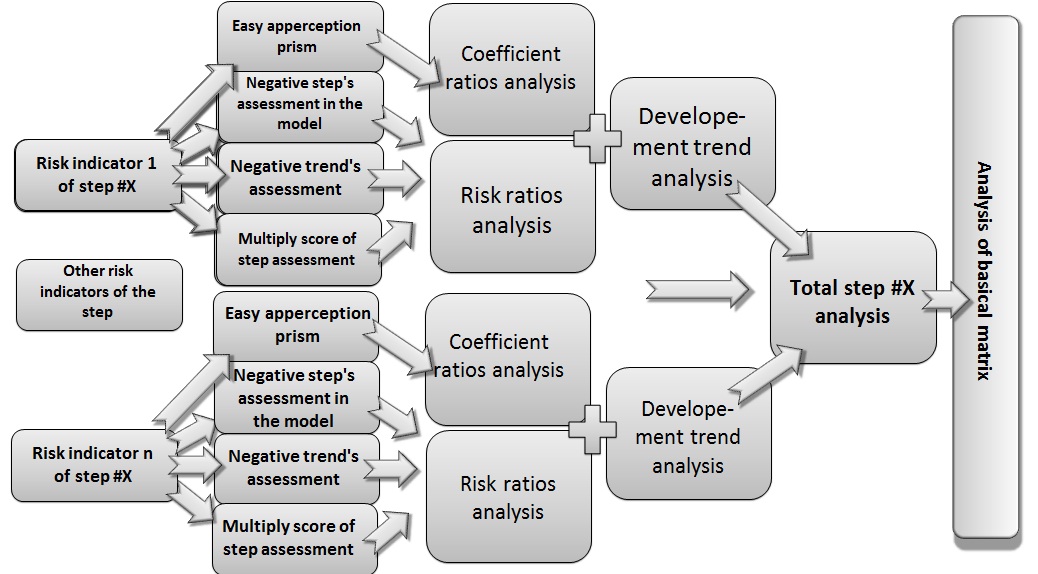 Fig. A – The general scheme of the algorithm and methodology for analyzing the stability of the enterprise risks Alexander Shemetev s1.jpg:1038x574, 161k |
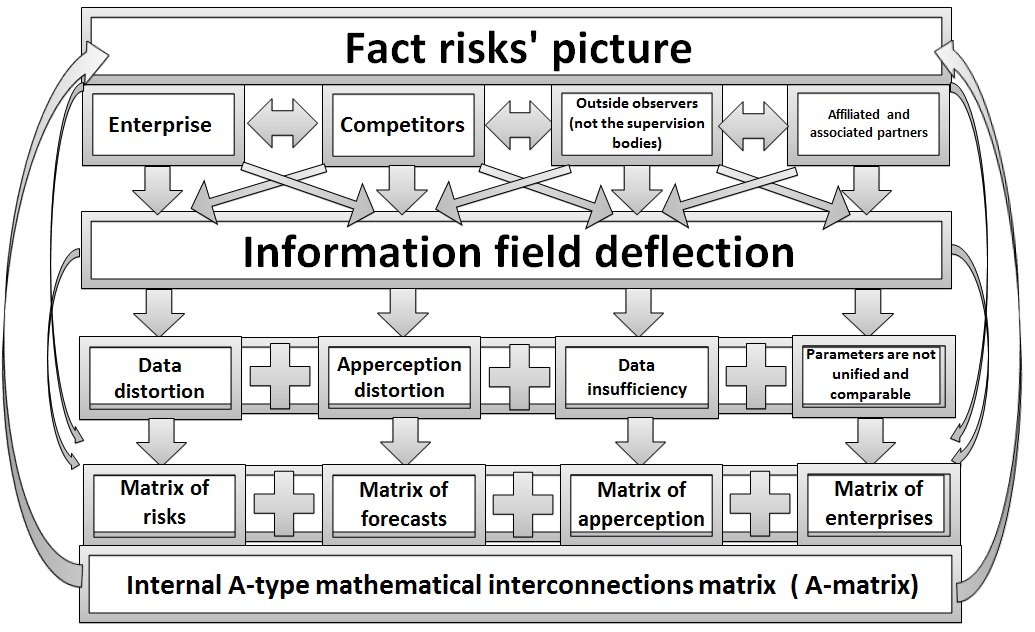 Fig. B – The general scheme of the A-matrix Alexander Shemetev s2.jpg:1035x632, 211k |
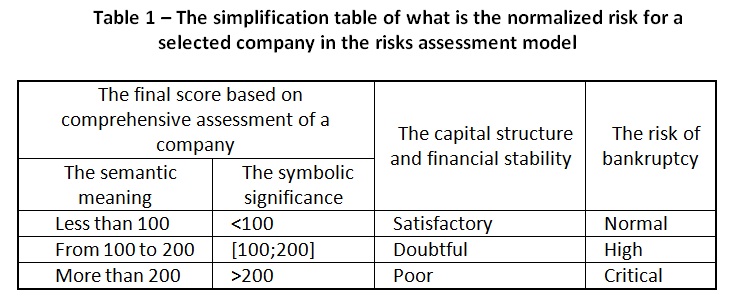 Table 1 – The simplification table of what is the normalized risk for a selected company in the risks assessment model Alexander Shemetev t1.jpg:735x303, 88k |
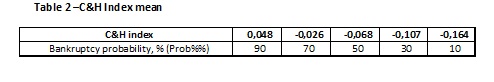 Table 2 –C&H Index mean Conan & Holder t2.jpg:494x82, 22k |
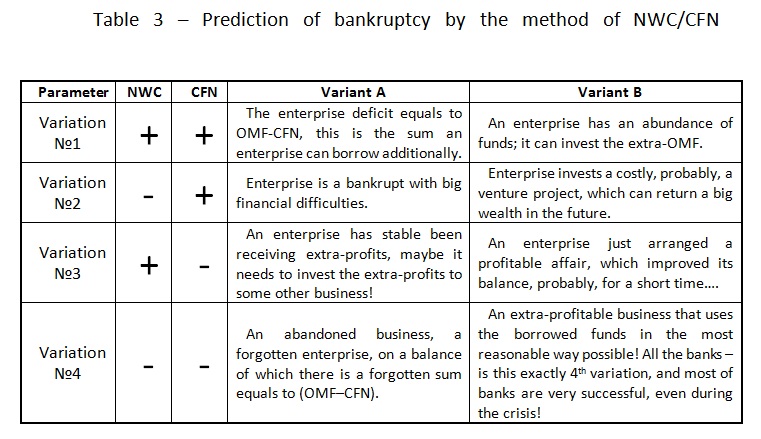 Table 3 – Prediction of bankruptcy by the method of NWC/CFN Alexander Shemetev t3.jpg:761x439, 142k |
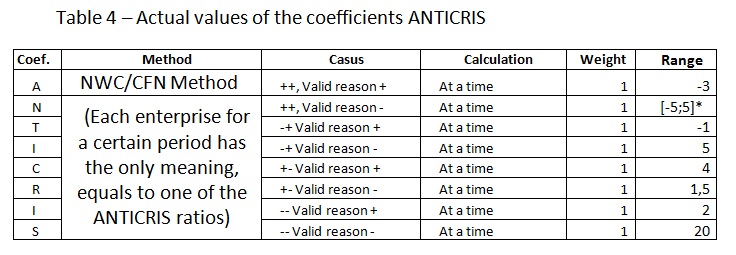 Table 4 – Actual values of the coefficients ANTICRIS Alexander Shemetev t4.jpg:736x255, 85k |
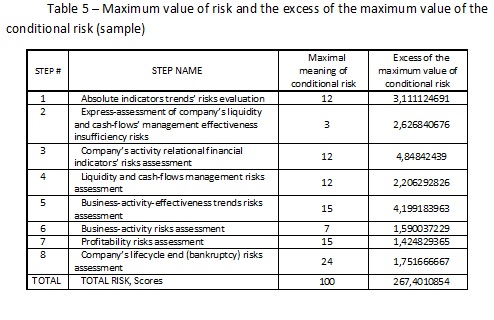 Maximum value of risk and the excess of the maximum value of the conditional risk (sample) Alexander Shemetev t5.jpg:494x320, 76k |
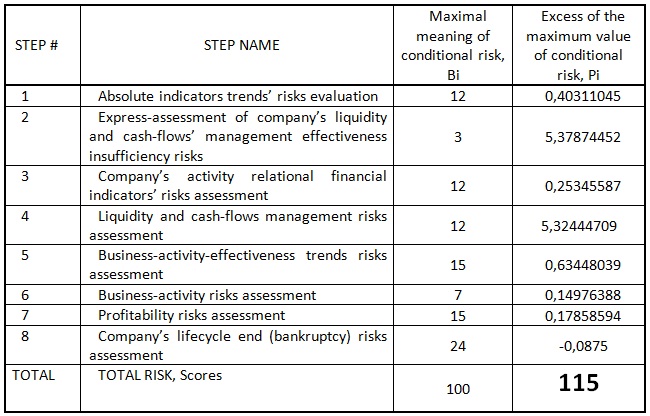 Maximum value of risk in the matrix sample Alexander Shemetev t51.jpg:650x416, 107k |
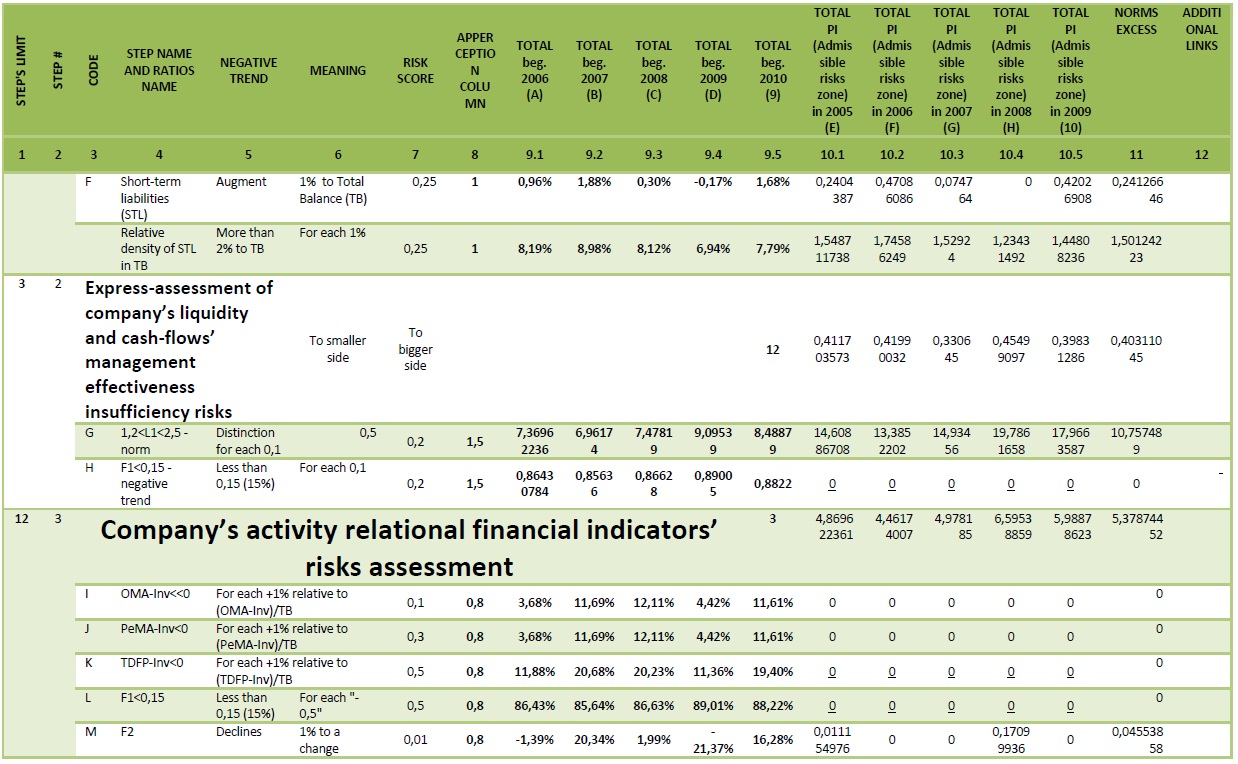
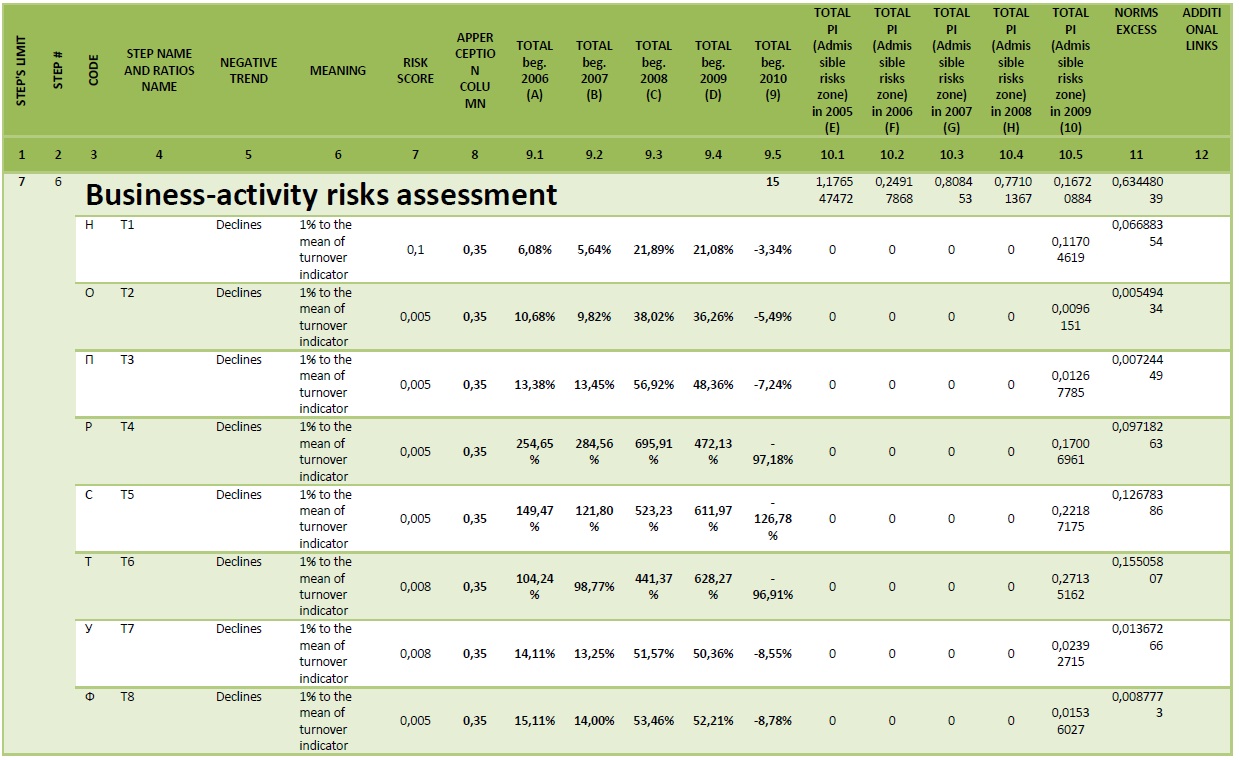
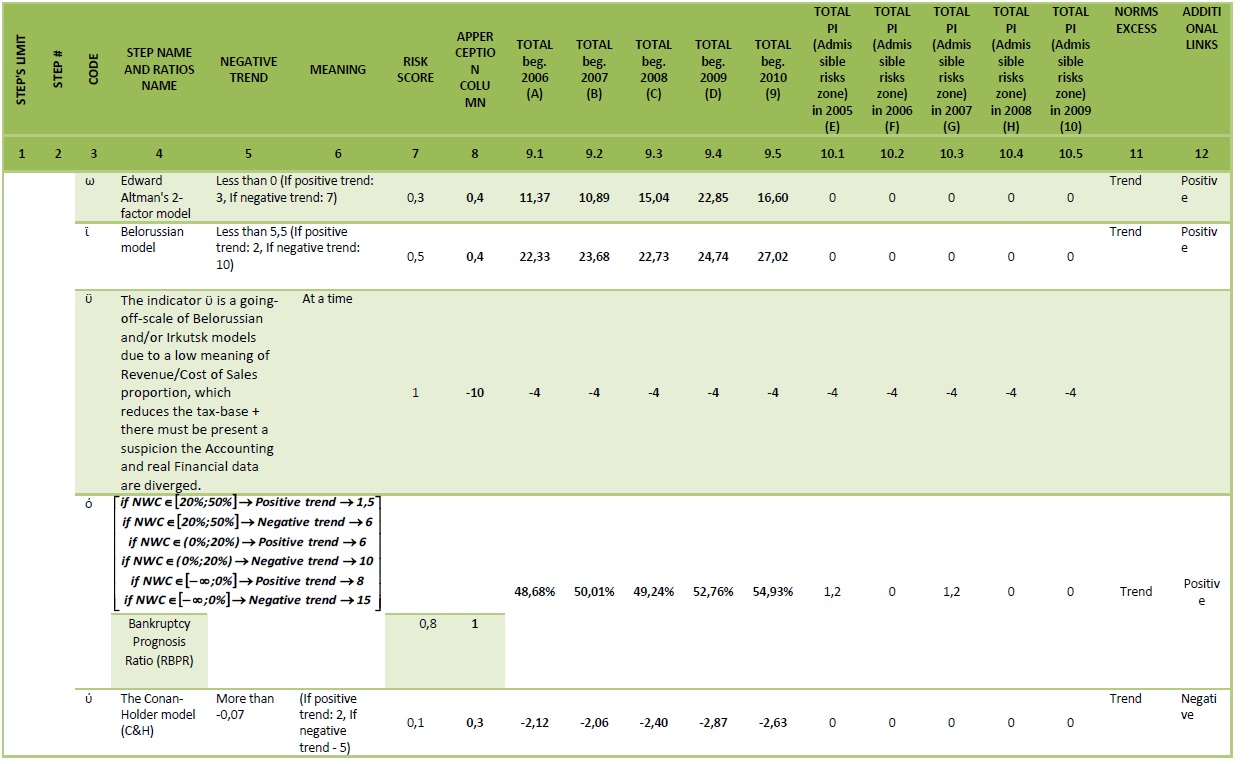
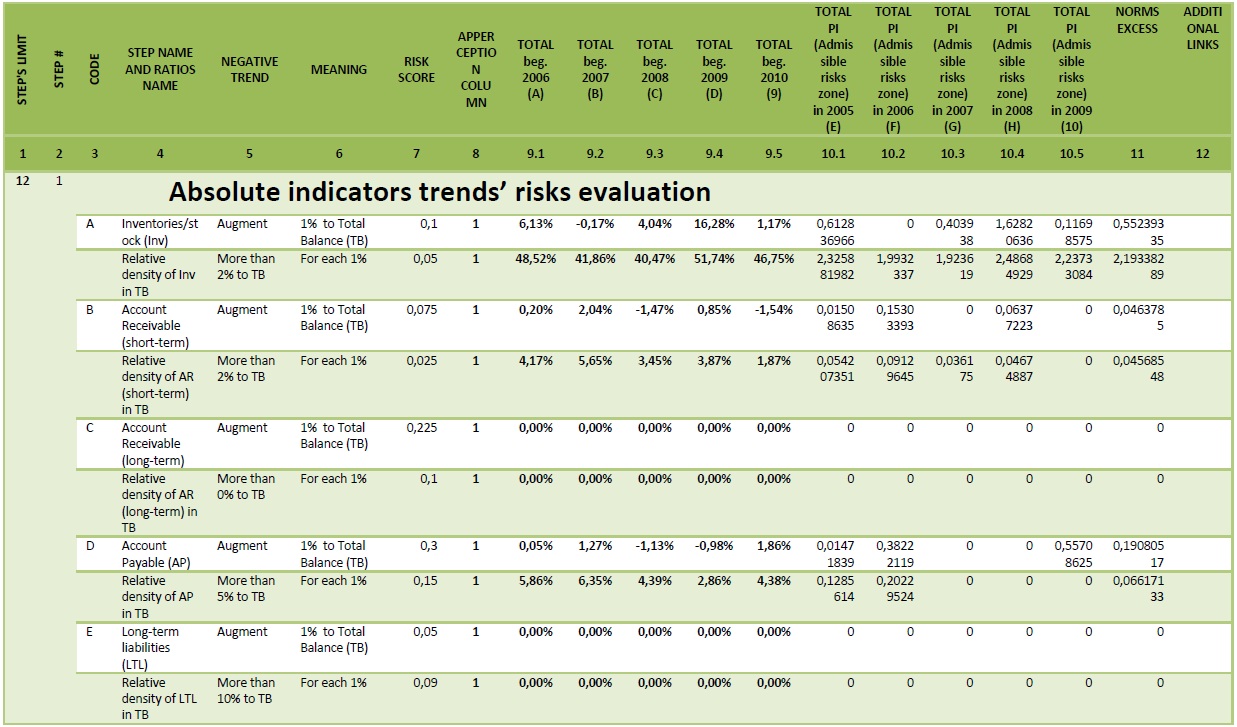 The matrix system of integrated risk analysis of the company Alexander Shemetev t61.jpg:1237x727, 269k |
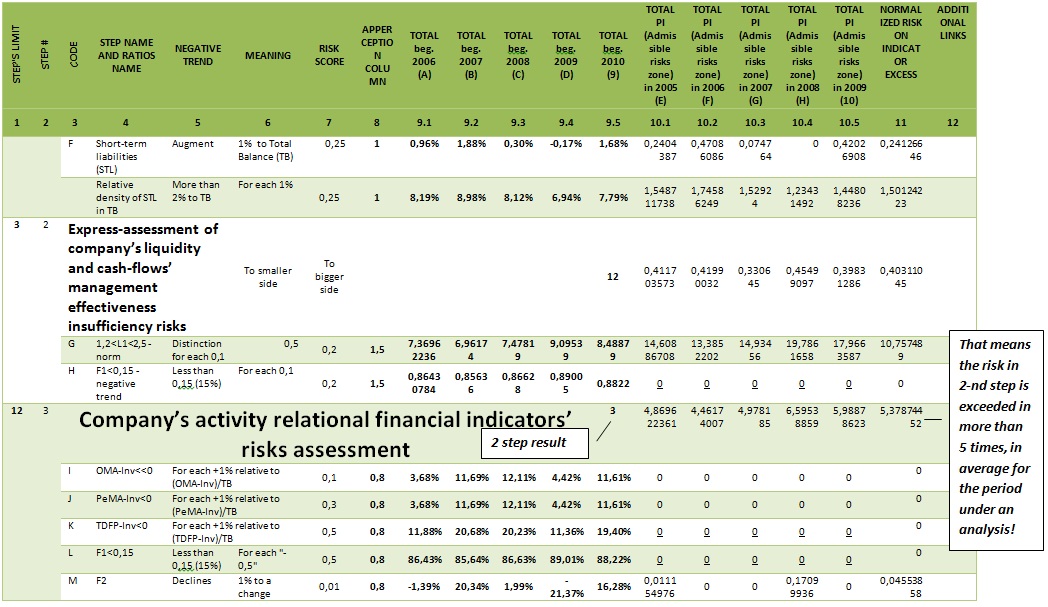
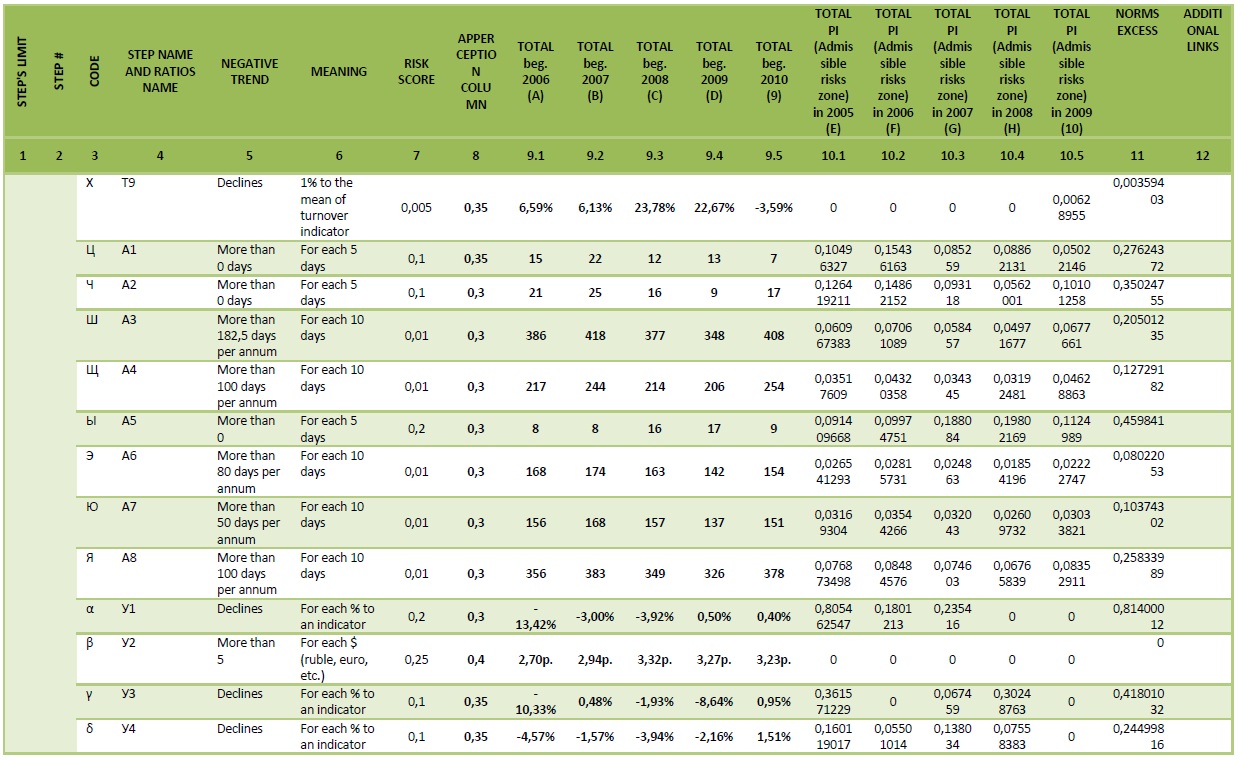
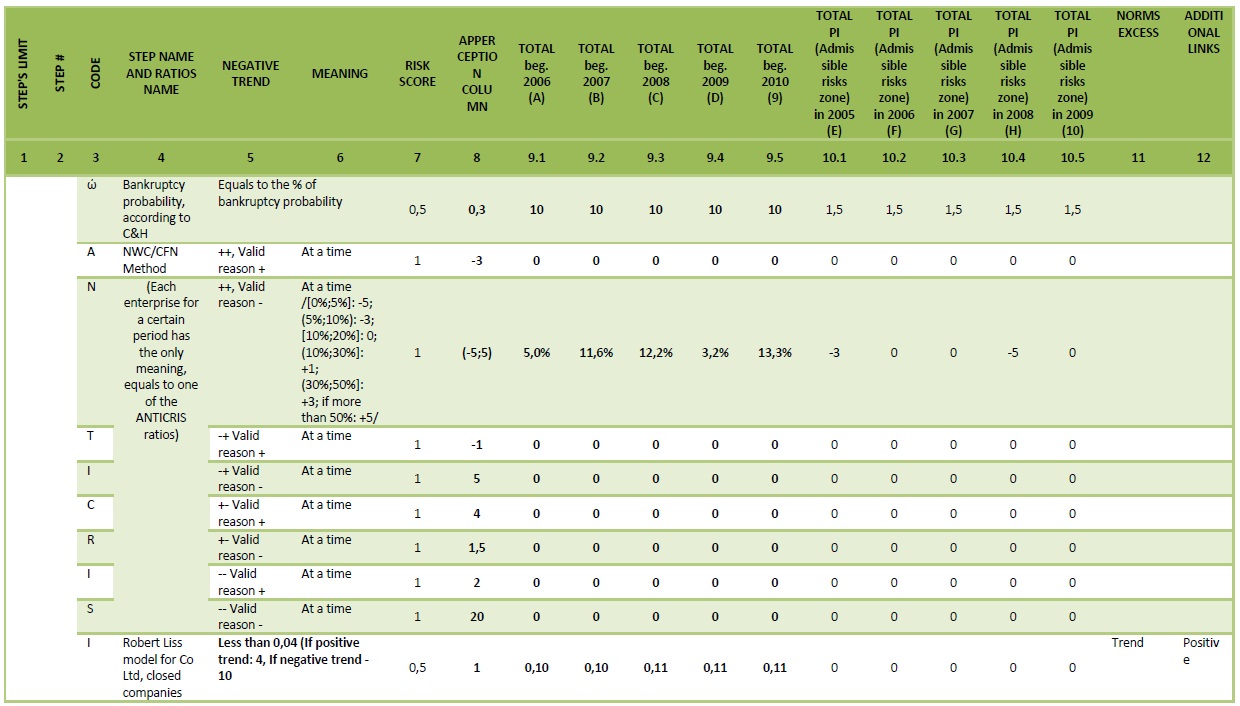
 The matrix system of integrated risk analysis of the company Alexander Shemetev t62.jpg:1238x764, 299k |
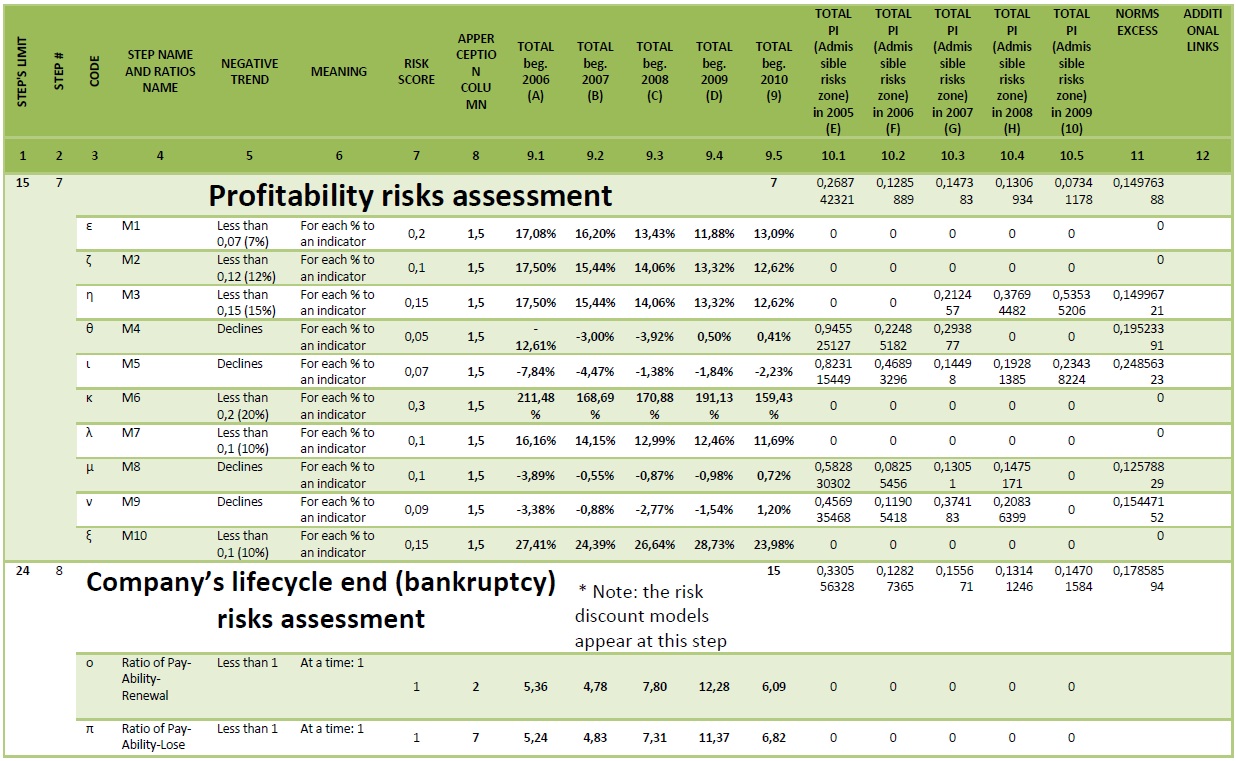
 The matrix system of integrated risk analysis of the company Alexander Shemetev t62a.jpg:1048x607, 221k |
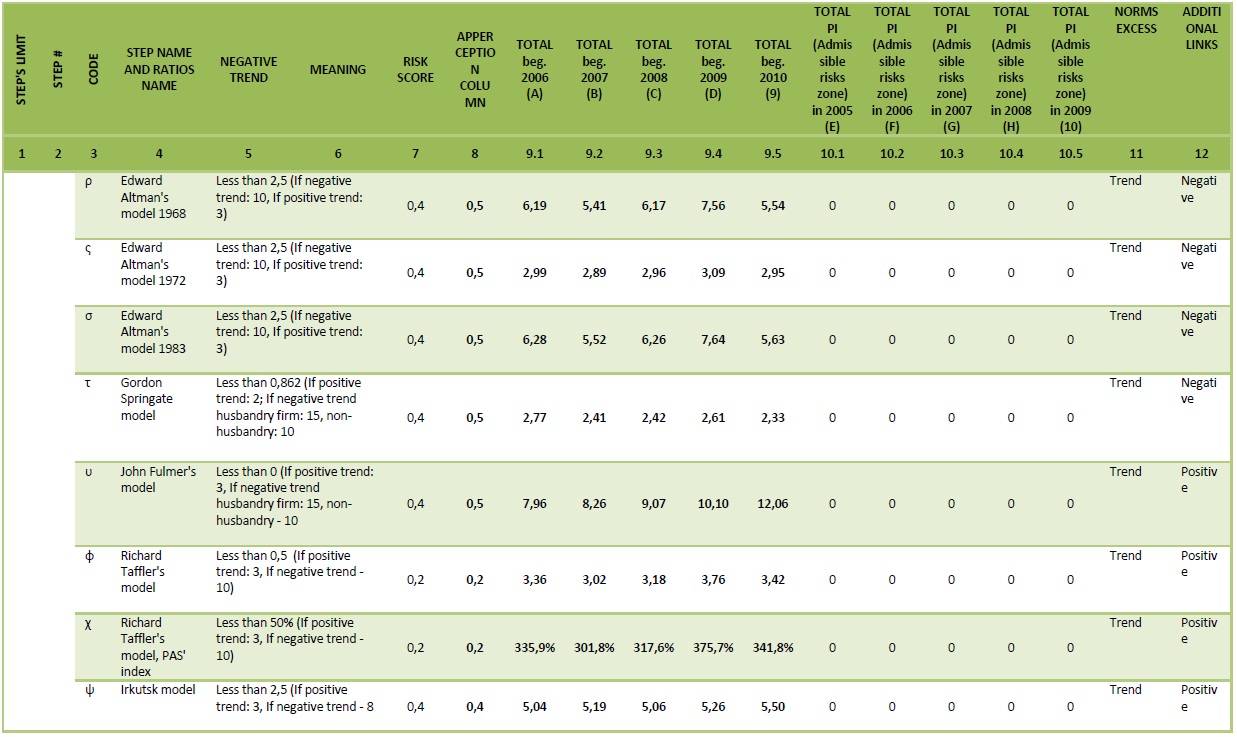
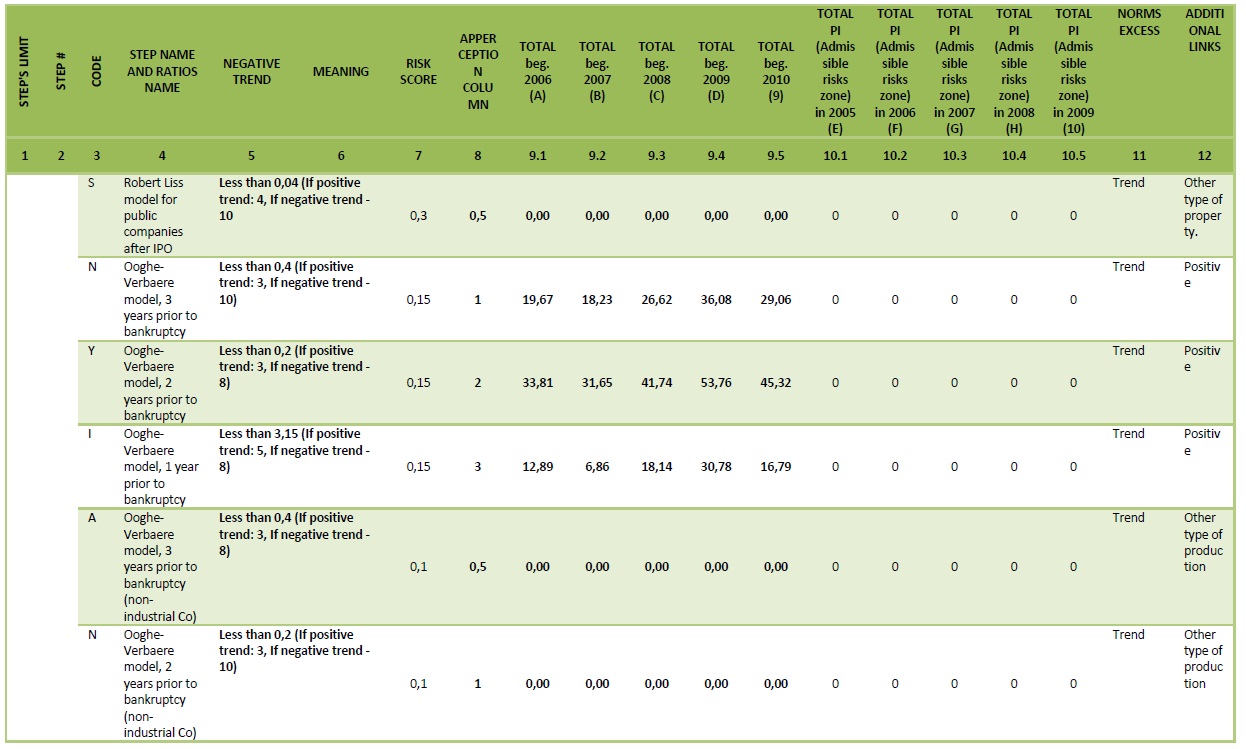
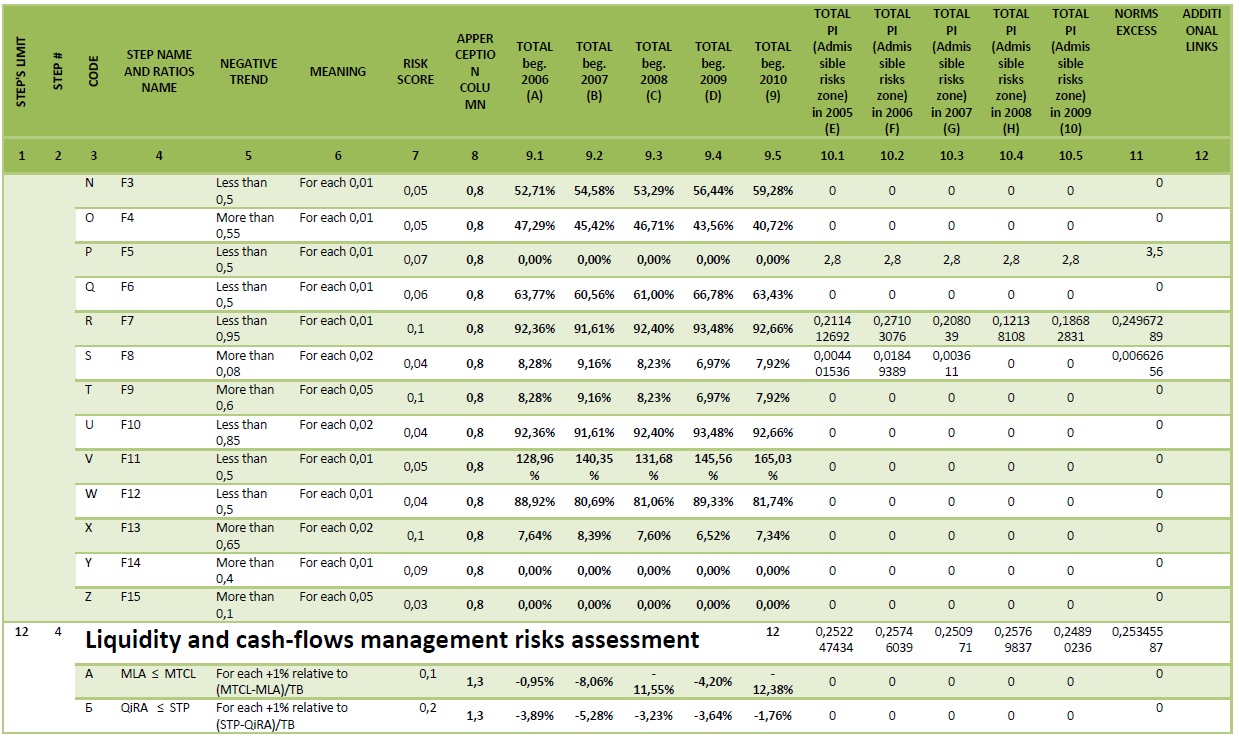 The matrix system of integrated risk analysis of the company Alexander Shemetev t63.jpg:1239x739, 307k |
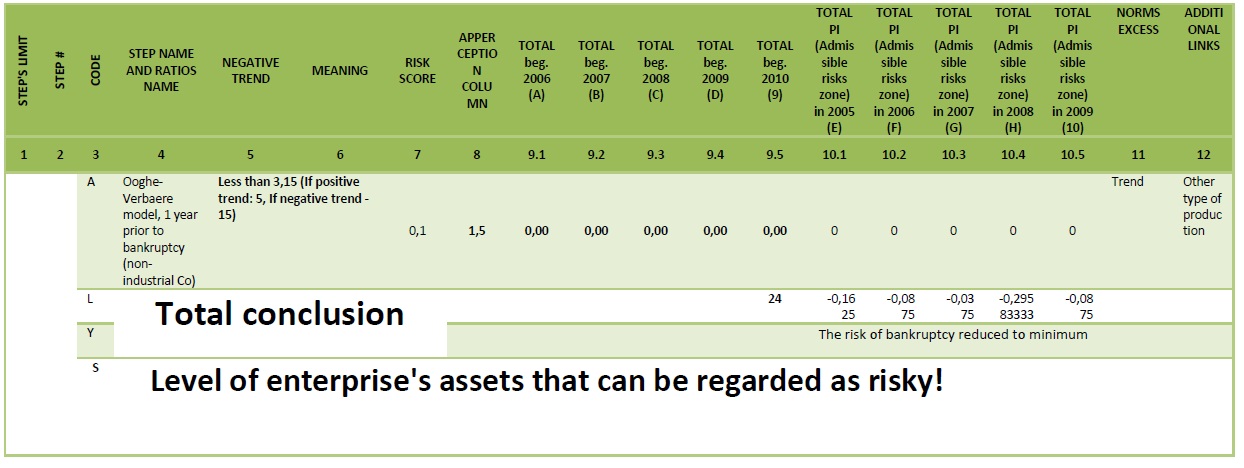
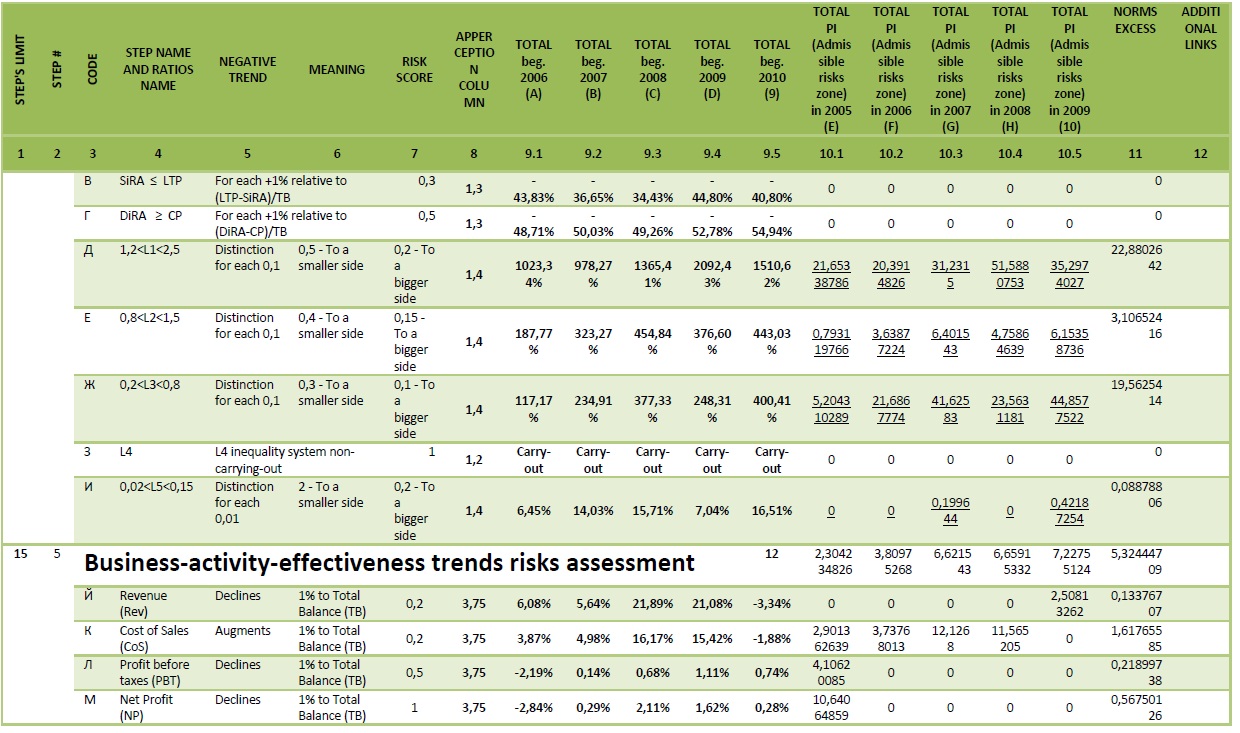 The matrix system of integrated risk analysis of the company Alexander Shemetev t64.jpg:1240x733, 310k |
 The matrix system of integrated risk analysis of the company Alexander Shemetev t65.jpg:1240x760, 244k |
 The matrix system of integrated risk analysis of the company Alexander Shemetev t66.jpg:1242x761, 303k |
 The matrix system of integrated risk analysis of the company Alexander Shemetev t67.jpg:1236x761, 326k |
 The matrix system of integrated risk analysis of the company Alexander Shemetev t68.jpg:1237x737, 227k |
 The matrix system of integrated risk analysis of the company Alexander Shemetev t69.jpg:1252x764, 206k |
 The matrix system of integrated risk analysis of the company Alexander Shemetev t70.jpg:1240x706, 209k |
 The matrix system of integrated risk analysis of the company Alexander Shemetev t71.jpg:1246x749, 204k |
 The matrix system of integrated risk analysis of the company Alexander Shemetev t72.jpg:1244x468, 146k |
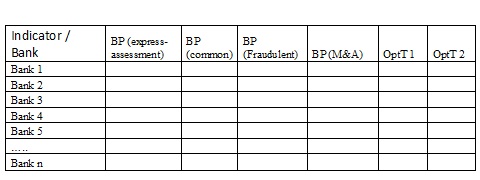 Table F – Short variant A-matrix of regional segmentation of the banking sector Alexander Shemetev tf.jpg:480x180, 26k |